import streamlit as st
from PIL import Image
import pandas as pd
import base64
import matplotlib.pyplot as plt
from bs4 import BeautifulSoup
import requests
import json
import time
Importer des packages.
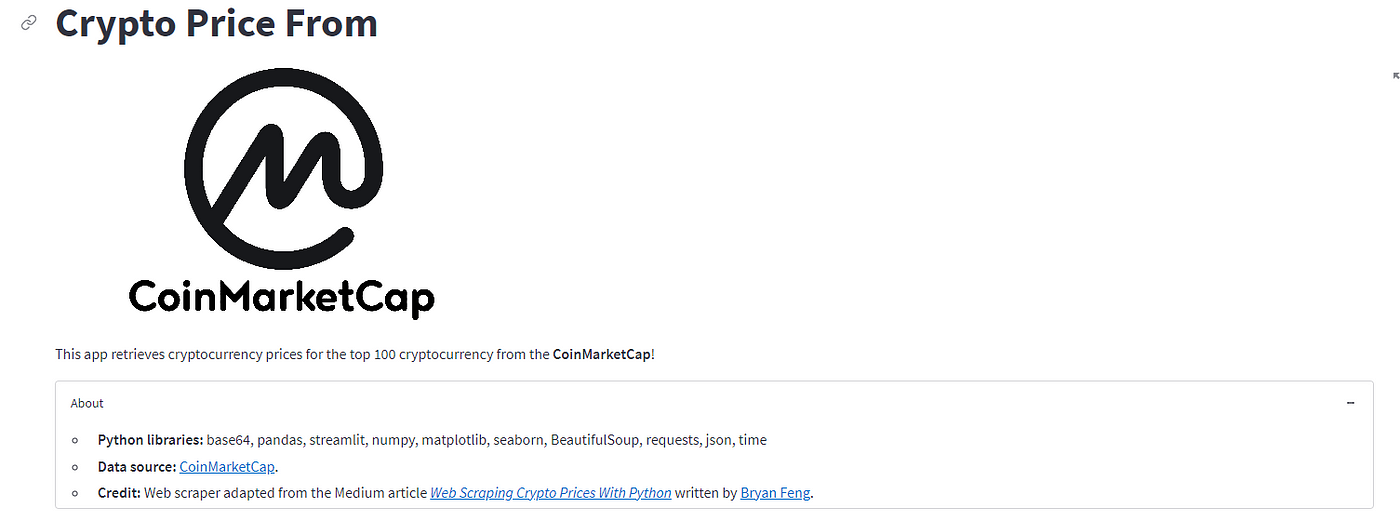
#---------------------------------## Titlest.title('Crypto Price From')image = Image.open('cmc/logo.png')st.image(image, width = 500)st.markdown("""This app retrieves cryptocurrency prices for the top 100 cryptocurrency from the **CoinMarketCap**!""")#---------------------------------## Aboutexpander_bar = st.expander("About")expander_bar.markdown("""* **Python libraries:** base64, pandas, streamlit, numpy, matplotlib, seaborn, BeautifulSoup, requests, json, time* **Data source:** [CoinMarketCap](http://coinmarketcap.com).* **Credit:** Web scraper adapted from the Medium article *[Web Scraping Crypto Prices With Python](https://towardsdatascience.com/web-scraping-crypto-prices-with-python-41072ea5b5bf)* written by [Bryan Feng](https://medium.com/@bryanf).""")
Définissez le titre et l’expandeur à propos.

#---------------------------------## Page layout (continued)## Divide page to 3 columns (col1 = sidebar, col2 and col3 = page contents)col1 = st.sidebarcol2, col3 = st.columns((2,1))#---------------------------------## Sidebar + Main panelcol1.header('Input Options')## Sidebar - base_currencybase_currency = col1.selectbox('Select currency for price', ('USD', 'BTC', 'ETH'))
Ajoutez 1 barre latérale col1 et une mise en page à 2 colonnes (col2, col3) au corps.

# Web scraping of CoinMarketCap data@st.cachedef load_data():cmc = requests.get('https://coinmarketcap.com')soup = BeautifulSoup(cmc.content, 'html.parser')data = soup.find('script', id='__NEXT_DATA__', type='application/json')coin_data = json.loads(data.contents[0])listings = coin_data['props']['initialState']['cryptocurrency']['listingLatest']['data']slugindex = listings[0]['keysArr'].index('name')symbolindex = listings[0]['keysArr'].index('symbol')priceindex= listings[0]['keysArr'].index('quote.'+base_currency+'.price')percent_change1hindex= listings[0]['keysArr'].index('quote.'+base_currency+'.percentChange1h')percent_change24hindex= listings[0]['keysArr'].index('quote.'+base_currency+'.percentChange24h')percent_change7dindex= listings[0]['keysArr'].index('quote.'+base_currency+'.percentChange7d')MarketCapindex= listings[0]['keysArr'].index('quote.'+base_currency+'.marketCap')volume24hindex= listings[0]['keysArr'].index('quote.'+base_currency+'.volume24h')coin_name = []coin_symbol = []market_cap = []percent_change_1h = []percent_change_24h = []percent_change_7d = []price = []volume_24h = []for i in listings[1:]:coin_name.append(i[slugindex])coin_symbol.append(i[symbolindex])price.append(i[priceindex])percent_change_1h.append(i[percent_change1hindex])percent_change_24h.append(i[percent_change24hindex])percent_change_7d.append(i[percent_change7dindex])market_cap.append(i[MarketCapindex])volume_24h.append(i[volume24hindex])df = pd.DataFrame(columns=['coin_name', 'coin_symbol', 'market_cap', 'percent_change_1h', 'percent_change_24h', 'percent_change_7d', 'price', 'volume_24h'])df['coin_name'] = coin_namedf['coin_symbol'] = coin_symboldf['price'] = pricedf['percent_change_1h'] = percent_change_1hdf['percent_change_24h'] = percent_change_24hdf['percent_change_7d'] = percent_change_7ddf['market_cap'] = market_capdf['volume_24h'] = volume_24hreturn dfdf = load_data()
Grattez les données de CMC.
Plus d’options dans la barre latérale :
## Sidebar - Cryptocurrency selectionssorted_coin = sorted( df['coin_symbol'] )selected_coin = col1.multiselect('Cryptocurrency', sorted_coin, sorted_coin)df_selected_coin = df[ (df['coin_symbol'].isin(selected_coin)) ] # Filtering data## Sidebar - Number of coins to displaynum_coin = col1.slider('Display Top N Coins', 1, 100, 100)df_coins = df_selected_coin[:num_coin]## Sidebar - Percent change timeframepercent_timeframe = col1.selectbox('Percent change time frame',['7d','24h', '1h'])percent_dict = {"7d":'percent_change_7d',"24h":'percent_change_24h',"1h":'percent_change_1h'}selected_percent_timeframe = percent_dict[percent_timeframe]## Sidebar - Sorting valuessort_values = col1.selectbox('Sort values?', ['Yes', 'No'])

Nous affichons les données et ajoutons un bouton de téléchargement pour un fichier .csv.
col2.subheader('Price Data of Selected Cryptocurrency')col2.write('Data Dimension: ' + str(df_selected_coin.shape[0]) + ' rows and ' + str(df_selected_coin.shape[1]) + ' columns.')col2.dataframe(df_coins)# Download CSV data# https://discuss.streamlit.io/t/how-to-download-file-in-streamlit/1806def filedownload(df):csv = df.to_csv(index=False)b64 = base64.b64encode(csv.encode()).decode() # strings <-> bytes conversionshref = f'<a href="data:file/csv;base64,{b64}" download="crypto.csv">Download CSV File</a>'return hrefcol2.markdown(filedownload(df_selected_coin), unsafe_allow_html=True)

#---------------------------------## Preparing data for Bar plot of % Price changecol2.subheader('Table of % Price Change')df_change = pd.concat([df_coins.coin_symbol, df_coins.percent_change_1h, df_coins.percent_change_24h, df_coins.percent_change_7d], axis=1)df_change = df_change.set_index('coin_symbol')df_change['positive_percent_change_1h'] = df_change['percent_change_1h'] > 0df_change['positive_percent_change_24h'] = df_change['percent_change_24h'] > 0df_change['positive_percent_change_7d'] = df_change['percent_change_7d'] > 0col2.dataframe(df_change)

Vous pouvez masquer cette partie car c’est pour le traitement des données.
La dernière colonne :
# Conditional creation of Bar plot (time frame)col3.subheader('Bar plot of % Price Change')if percent_timeframe == '7d':if sort_values == 'Yes':df_change = df_change.sort_values(by=['percent_change_7d'])col3.write('*7 days period*')plt.figure(figsize=(5,25))plt.subplots_adjust(top = 1, bottom = 0)df_change['percent_change_7d'].plot(kind='barh', color=df_change.positive_percent_change_7d.map({True: 'g', False: 'r'}))col3.pyplot(plt)elif percent_timeframe == '24h':if sort_values == 'Yes':df_change = df_change.sort_values(by=['percent_change_24h'])col3.write('*24 hour period*')plt.figure(figsize=(5,25))plt.subplots_adjust(top = 1, bottom = 0)df_change['percent_change_24h'].plot(kind='barh', color=df_change.positive_percent_change_24h.map({True: 'g', False: 'r'}))col3.pyplot(plt)else:if sort_values == 'Yes':df_change = df_change.sort_values(by=['percent_change_1h'])col3.write('*1 hour period*')plt.figure(figsize=(5,25))plt.subplots_adjust(top = 1, bottom = 0)df_change['percent_change_1h'].plot(kind='barh', color=df_change.positive_percent_change_1h.map({True: 'g', False: 'r'}))col3.pyplot(plt)

Github : https://github.com/NoEdgeAtLife/Streamlit-data-web-app/tree/main/cmc
Rejoignez Coinmonks Telegram Channel et Youtube Channel pour en savoir plus sur le trading et l’investissement cryptographiques
